Reliable data is crucial. Saving time while gathering it is important too. But what truly makes an impact is how well you organize and visually present that data. When sharing dashboards and reports with internal or external audiences, it’s essential that your data is not only accurate but also well-structured and easy to interpret. That’s where we come in. So, how do we make it visual?
We've added several features to help you and your users better understand and manage your data.
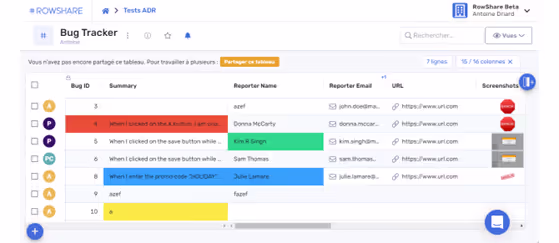
Color, just color
After having streamlined our user interface and removed most of the color around RowShare tables, it was finally time to let you color cells, rows and columns as you want.
One needs write permission to color a cell or row and only table admins can color a full column. And of course the color is visible to anyone accessing the table.
Analyze your data
Once your table grows beyond a few dozen rows, analyzing it as a whole becomes increasingly challenging.
Group your rows as you wish. If you want your data to be grouped by shift? By status? By geography? By owner? Head to the column you want, click on the column menu, then click “Group by …”, and you’re done!
For each group of rows, you can see the aggregated numerical values, and get the sum, average, minimum or maximum, and first or last value… of each group.
Groups of columns
RowShare has received numerous requests from Excel users who have recently started using it, asking for this feature: the ability to include a header above several columns. We have made that possible. Simply access the settings of a particular column and provide the name of its column group. Your data will be looking great in no time.
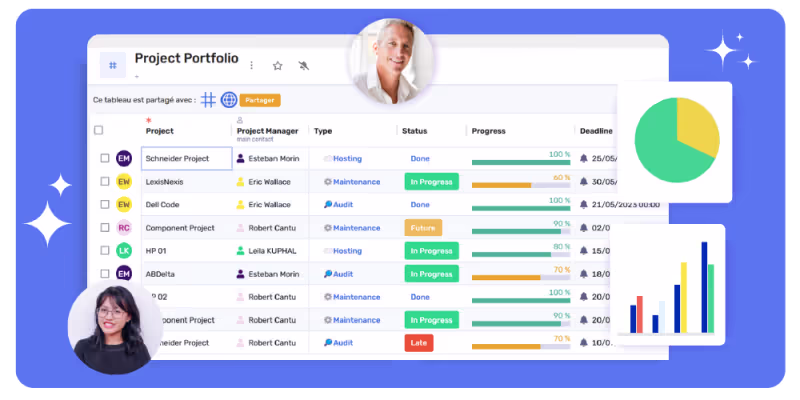
Need to view your data with charts and graphs?
Your inputs are collected and added to your RowShare tables. Congrats, that’s already a good step. Now add an analysis and visual dimension to it. With RowShare’s new charts. Analyze and share your important figures more visually. Your data is always available and up to date in our charts! Find all the ways to view the data stored in your RowShare charts in this article from our FAQ.
Charts are displayed next to your data, always up to date. Click on any chart to view it full screen or export it.
Connect your every day tools
Need more than just a few charts, a dashboard that draws from multiple RowShare tables, or other data sources? Then we’ll help you connect RowShare to Power BI or any other data visualization tools like QlikView or Tableau to get your data talking even more.